May 2023

  • The latest webinar presented by Dan Bort, Physics Encounters Consciousness, is now available for viewing on the webinars page. You can also view the bibliography for Dan’s presentation.
  • Check out the latest schedule for the 55th reunion and, if you haven’t already, sign up!
  • I am sorry to report the sudden death of another classmate, Peter Warner. In addition, our classmates, Steve Engelman and John McNary, the later of whom only attended Dartmouth our freshman fall term died recently.
  • The class directory has been updated as of April 2023. You should have received in the mail by now. Contact the webmaster if you would like an electronic version in PDF.
  • Read the May-June edition of the 1968 Alumni Magazine column.
  • Read the Spring 2023 edition of the classs Newsletter. It’s a big one!
  • See the Final Schedule of Events for our 55th reunion.
  • Our May 16, 2023 webinar, Discovering Edward Mitchell (Dartmouth’s first black graduate) is now available for viewing on the webinars page.
  • Minutes from the 4/8/23 Class Committee meeting are available

Scroll down to learn more about this month's featured image from the James Webb Space Telescope and to see more site updates.

Click on the image to enlarge

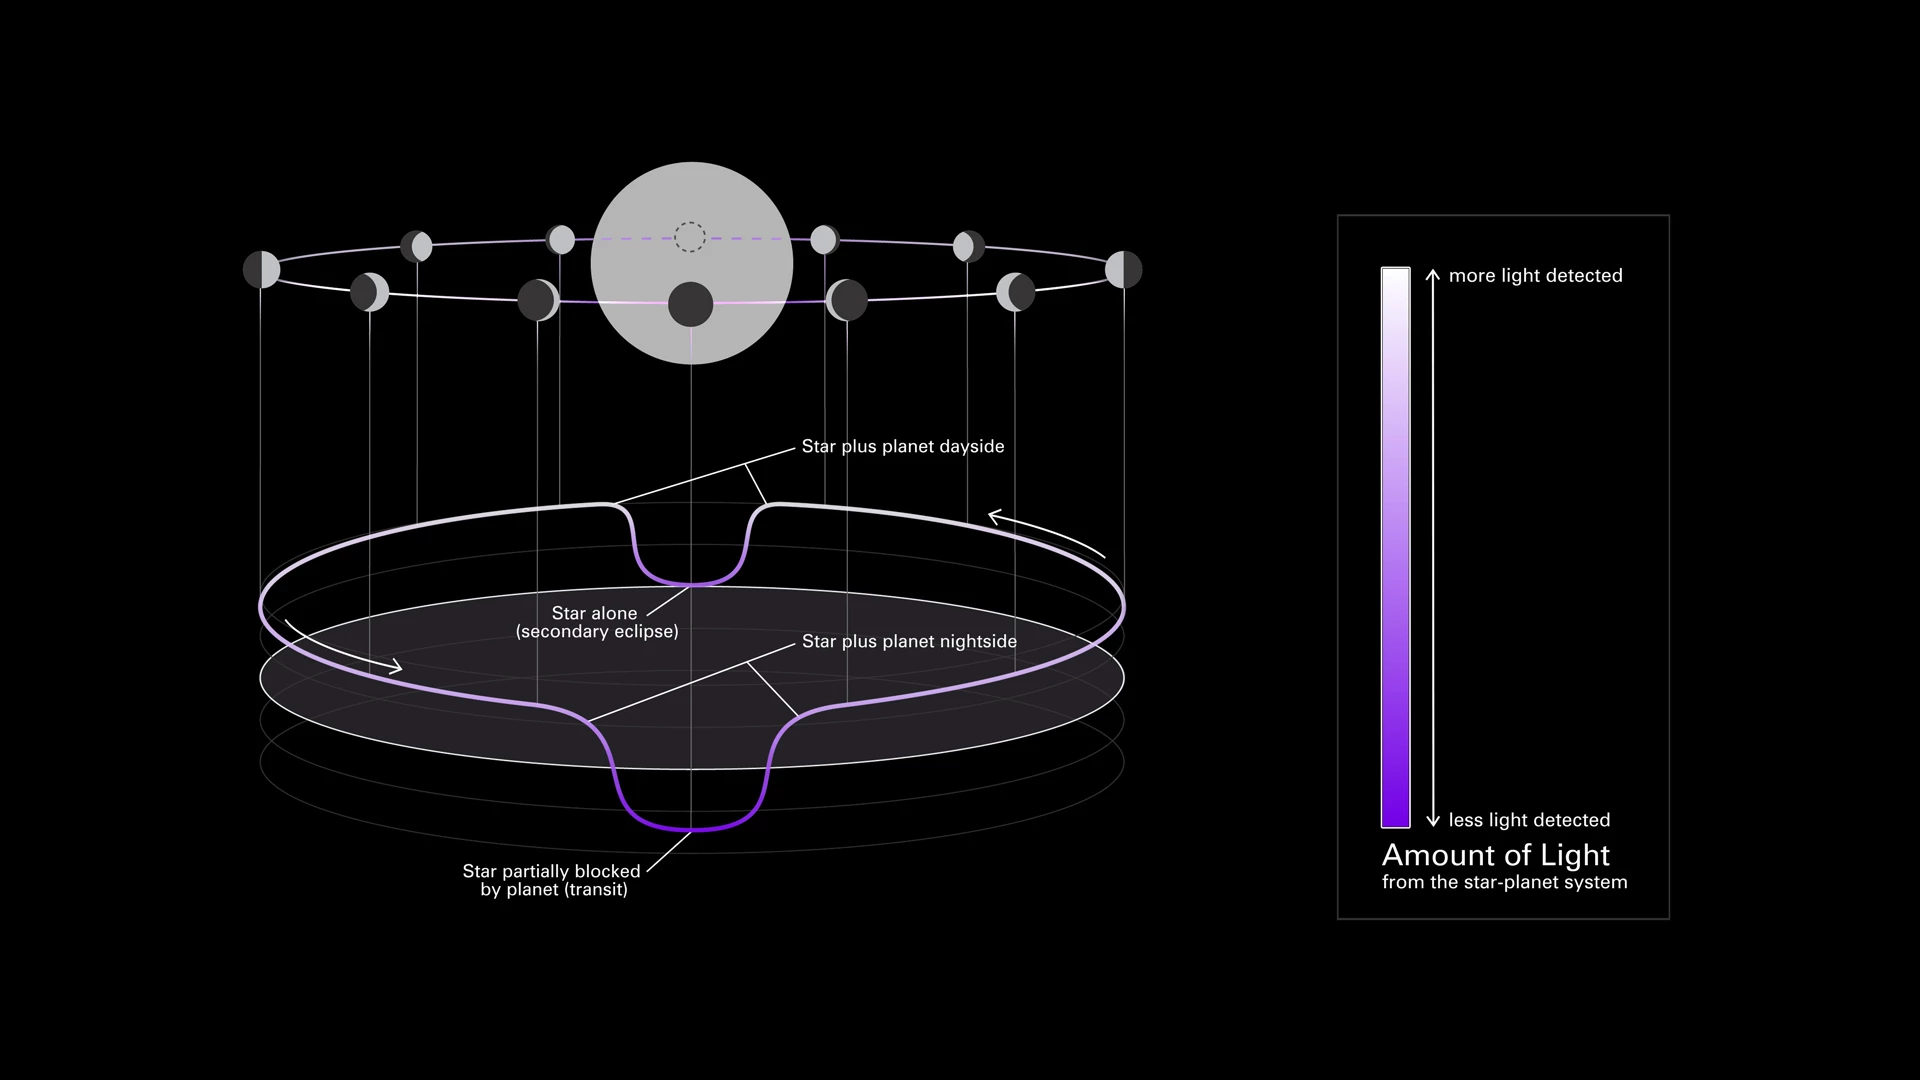
Diagram of affect of distant planets on light from their stars
This simplified diagram of an exoplanet phase curve shows the change in total brightness of a star–planet system as the planet orbits the star. The system looks brighter when more of the lit side of the planet is facing the telescope (full phase). It looks dimmer when more of the dark side is facing the telescope (new phase), when the planet is blocking some of the starlight (transit), and when light from the planet is blocked by the star (secondary eclipse). (Top) Diagram showing the change in a planet’s phase (the amount of the lit side facing the telescope) as it orbits its star. (Bottom) Three-dimensional graph showing the change in the total brightness of the star–planet system as the planet orbits its star. In this graph, known as a light curve, the horizontal plane is orbital location and the vertical axis is brightness. (Right) Scale bar. In both the orbital diagram and the light curve, color indicates the observed brightness of the star + planet: from dark purple (less amount of light detected) to white (more light detected). Researchers use phase curves to study variations in reflectivity and temperature of a planet with longitude (from one side to another), which can provide insight into the surface composition and atmospheric conditions of the planet.

Recent Site Updates

October 2024

Topics Updated

Click here to open the monthly update details page. On the details page you will also have access to all monthly updates back to January 2023.

September 2024

Topics Updated

Click here to open the monthly update details page. On the details page you will also have access to all monthly updates back to January 2023.

August 2024

Photograph of planet Neptune with moons and rings

Topics Updated

Click here to open the monthly update details page. On the details page you will also have access to all monthly updates back to January 2023.